Green and Blue One Pager Quarterly Stock Performance Report Document


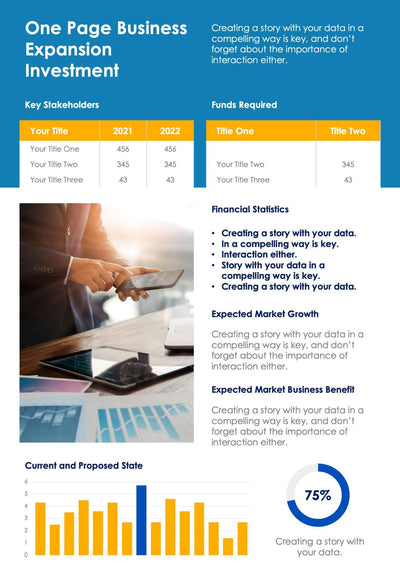
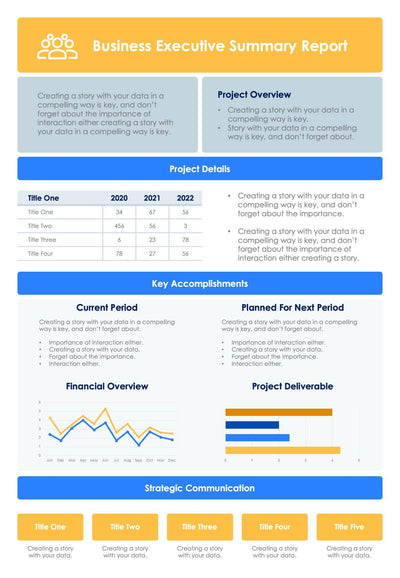
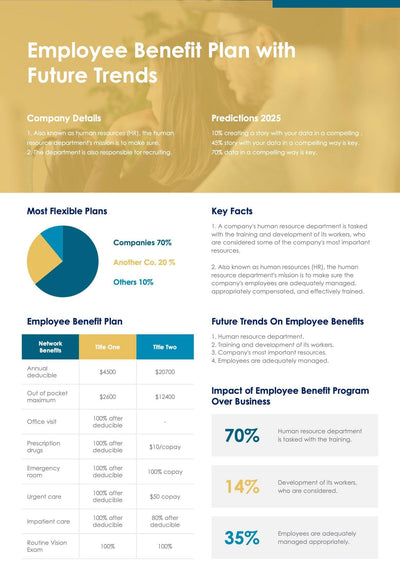
Put a quarter of stock results on one page with the green and blue quarterly stock performance report. A navy photo header with the title on the right sits over green section bars and a large line chart.
What's on the page
- A Company Overview section with four short bullet points
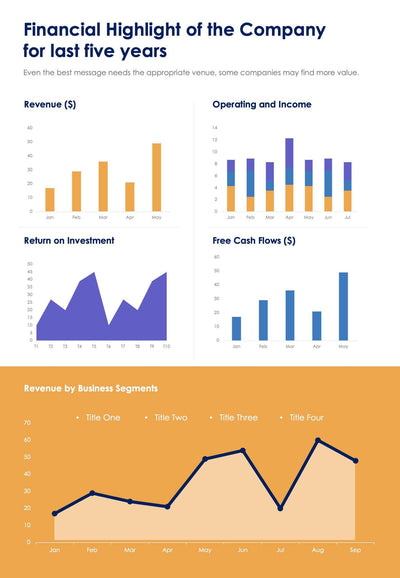
- A green line chart from January to December with a large sample total above it
- A Key Ratios row with four client columns
- A pie chart for four sales representatives
- Three big green percentages, 47%, 10% and 34%, each with a short note
You can send it to your investors after each quarter or bring it to a board meeting as a handout. It also suits a monthly sales review when your team wants one page instead of a long deck. The big line chart sits in the middle of the page, so your reader sees the trend before anything else.
The sample text and figures are placeholders, so type in your own before you send it. Start with the header line and the Company Overview bullets. Then open the line chart and put in your own monthly values, from January to December, and set the big total above it. Next, fill the Key Ratios row with a short line for each client. The pie chart takes your four sales reps' shares. Last, set the three big percentages at the bottom and write a note beside each one. You can change the charts and text in PowerPoint or Keynote.