EMEA Region Map Infographic Slide Template


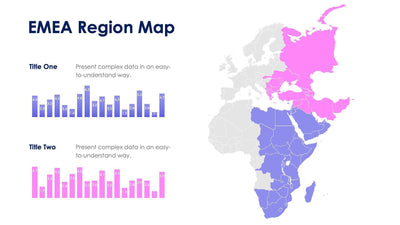
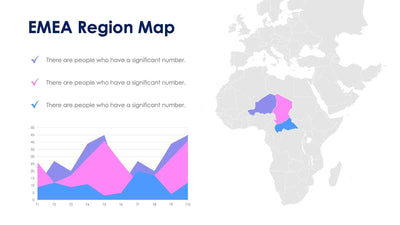
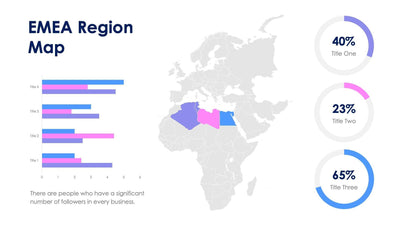
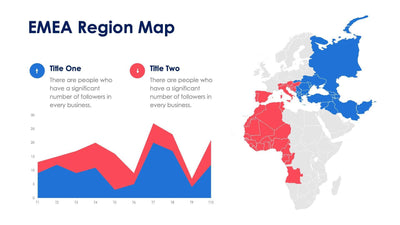
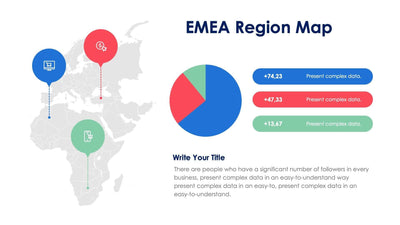
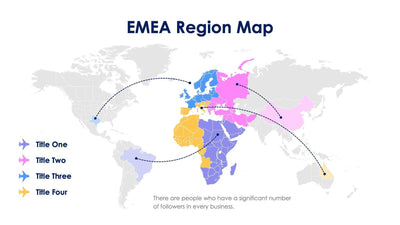
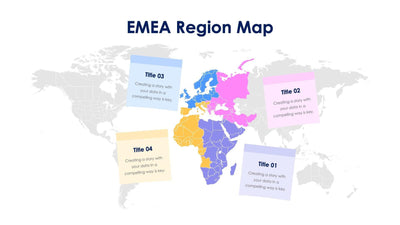
An EMEA region map slide pairs a map of Europe, the Middle East and Africa with your key numbers. Four ring charts on the left show percentages, and the map on the right is split into four colored areas.
What's on the slide
- An EMEA Region Map title at the top
- A map of Europe, the Middle East and Africa in green, red, yellow and blue
- Four ring charts in matching colors with sample values of 40%, 23%, 65% and 47%
- A placeholder label under each percentage, from Title One to Title Four
You can show regional sales or market share by area here. It works well in a quarterly business review, where your audience wants one number per region before the detail slides.
Each ring matches one color on the map. The blue ring goes with the blue area, the red ring with the red area, and so on. Start by naming your four regions in the labels under the rings, in place of Title One to Title Four. Then type your own percentage in the center of each ring and stretch the colored arc to match it. The sample arcs already show you how a small share and a large share look. Unlike the first EMEA slide in the set, this version zooms in on the region and drops the rest of the world.
You can update the numbers and labels in PowerPoint or Keynote.