Yellow and Blue Financial Report Infographic Template


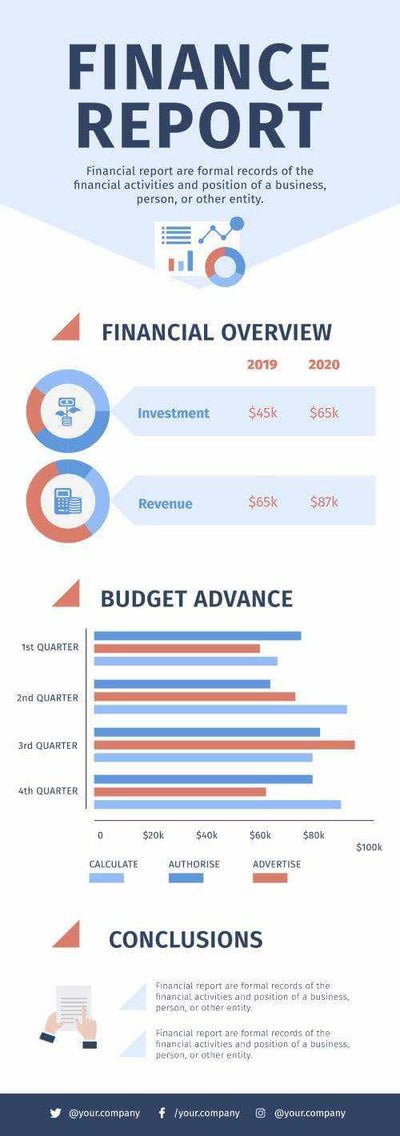
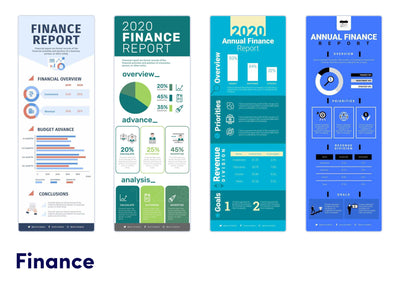
Three years of sample business numbers stack down one tall navy and yellow page in the financial report infographic. A bar chart sits at the top, three doughnut charts in the middle and two large percentages at the bottom.
What's on the infographic
- A Financial Report title over a short printed definition
- A Years Projection bar chart of imports, exports and sales for 2019, 2020 and 2021
- A Clients Data row with doughnut charts for age, gender and continent, each over a small table
- A Conclusions About Clients block next to a figure at a laptop
- A sales-by-platform row with desktop and mobile shares of 34% and 66%
You might share it in a yearly review with your board or post it as a one-page summary for your clients. The page reads from top to bottom, so your audience sees the big totals first and the details about clients after that.
The figures are samples, so swap in your own numbers before you share it. Start with the header and the line under the title, and write them in your own words. Then open the bar chart and enter your own figures for each year. Next, set the three doughnut charts and the small tables under them to your own client figures. The Conclusions About Clients block has two lines for your main points. A navy footer holds placeholder social handles. You can edit the charts and text in PowerPoint, Keynote or Illustrator.