Table Slide Infographic Template


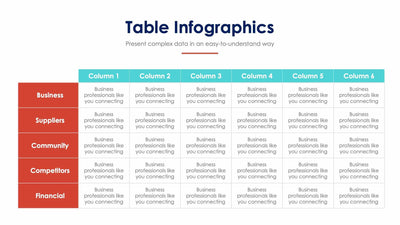
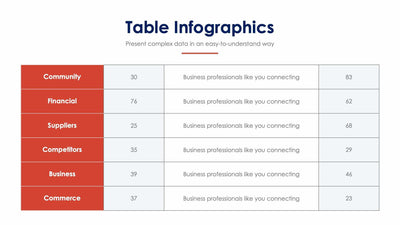
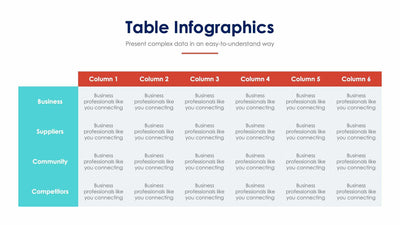
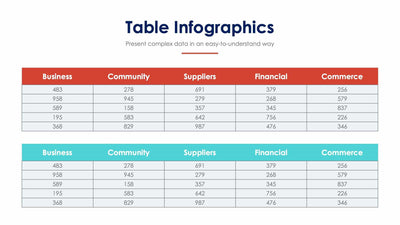
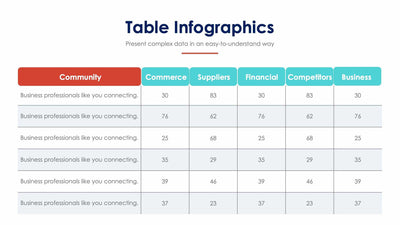
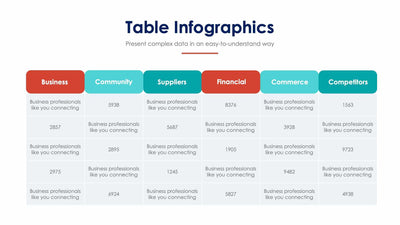
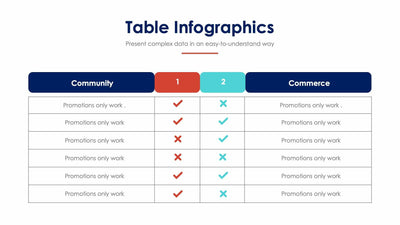
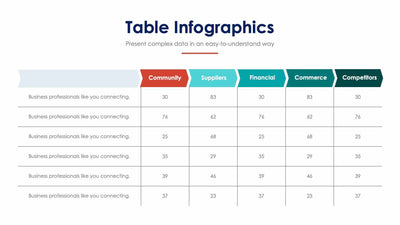
Five items and five measures meet in one grid on the table slide infographic template. A colored icon header tops each column, so your audience reads the grid fast.
What's on the slide
- A Table Infographics title with a short subtitle and a green line
- Five column headers in green, navy, coral, yellow and blue, each with a line icon
- Five rows labeled Title One to Title Five
- Sample percentages in every cell that you replace with your own figures
It works well for comparing five products or five teams on the same measures. You could show it in a quarterly review, so your managers can scan each row and spot where a number is low.
Replace the sample percentages with your own figures before you present. First, decide what each column measures and pick an icon that fits. The headers hold icons only, so you may want to add a short word under each icon to name the measure. Then rename Title One to Title Five with the items you are comparing. Fill the grid row by row. If a column needs a number in place of a percentage, just type it in. The colors help your audience match each column to its icon.
You can recolor the column headers in PowerPoint, Keynote or Google Slides.