Restaurant Industry Infographic Template


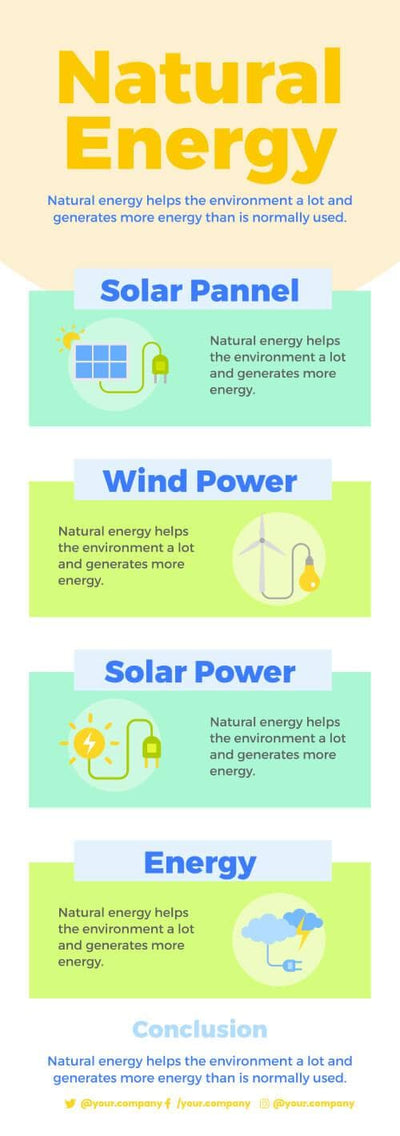
Restaurant facts fill one tall graphic in the restaurant industry infographic. It sits on a deep plum background with bright pink, green, yellow and orange rings.
What's in the infographic
- A Restaurant Industry title and a short intro paragraph
- Four ringed stat circles at the top with icons of money, a cafe, a chef and a server
- A big fork and spoon with four labels around them: Carbohydrates, Protein, Energy and Nutrients
- Four more stat circles near the bottom with a wallet, a wine bottle, a waiter and a croissant
- Three social handle placeholders along the plum footer
You can post it on your food blog or share it with a hospitality class. The tall shape fits a long scroll on a phone, and it works as a pin too.
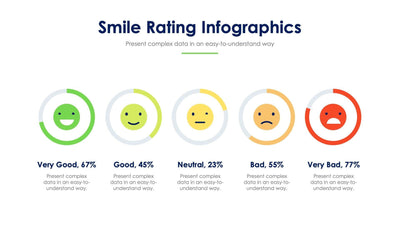
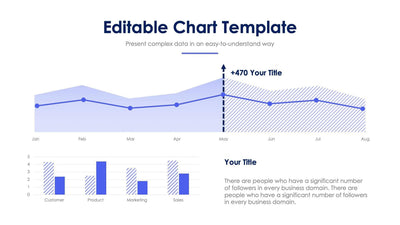
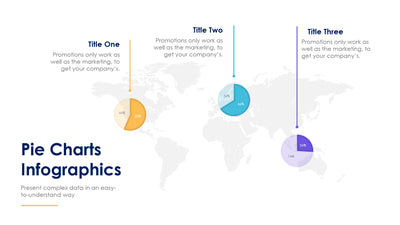
The stat circles hold sample figures, so put in your own from a source you trust. Start at the top with the title and the intro paragraph. Then fill the eight ringed circles, each with a big number and a short label under it. The fork and spoon in the middle break the page into two halves. You can give the four labels around them your own short notes. Last, put your handles in the plum footer so readers can find you. You can work on the layout in PowerPoint, Keynote, Google Slides or Illustrator, and you can swap the bright ring colors for your own brand colors.