KPI Dashboards Slide Infographic Template


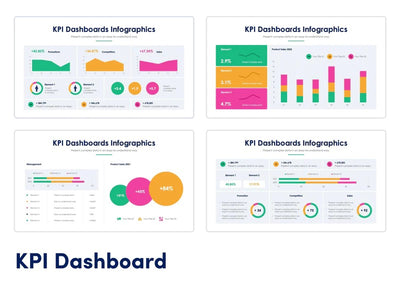
Three key results get their own charts on the KPI dashboards slide. It splits into four light gray panels in shades of blue.
What's on the slide
- A KPI Dashboards title with a one-line subtitle
- A left panel with three icons, Title One to Title Three, and a few lines of placeholder text each
- A tall stacked bar chart on a scale from 0 to 18
- Three ring charts with icons, labeled Title One to Title Three
- A stacked area chart that runs from T1 to T10
Put it in your monthly report or show it at a team meeting when you need your main numbers on one screen. Your manager sees the whole picture at a glance.
Start with the left panel. Name your three key results there, one per icon, and write a short line under each. Then type your own values into the charts. The bar chart suits weekly or monthly counts, and the ring charts show how far you are toward each target. The area chart along the bottom runs from T1 to T10, so you can rename those labels as weeks or months. T1 can become Week 1. All the blues match, so the slide still looks clean once your own numbers go in. You can rename each title and change the chart data in PowerPoint or Keynote. Its product code is S06102240.