IMRaD Slide Infographic Template


An IMRaD slide lays out the structure of a research paper on one slide. It stacks each part of a paper as a colored shape, with an arrow beside it for your notes.
What's on the slide
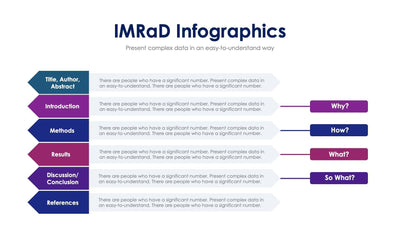
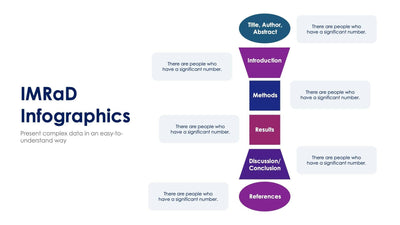
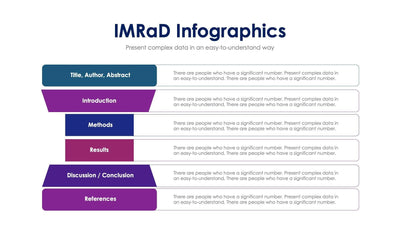
- Six shapes in blue and purple: Title, Author, Abstract, then Introduction, Methods, Results, Discussion/Conclusion and References
- An arrow next to each shape with placeholder text you replace
- The questions Why?, How?, What? and So What? beside the four middle parts
- A large IMRaD Infographics heading on the right with a short subtitle
Science teachers and thesis advisers can use it to show students how a paper is built. You can also outline your own study with it before a lab meeting or a defense.
The shapes run from top to bottom in the order a paper is read. Introduction and Discussion are wide at one end and narrow at the other, so the slide looks like an hourglass around Methods and Results. Each shape has an arrow beside it with two lines of placeholder text. Write one short note in each arrow, such as what goes in that part or what your own study found. The four questions on the right give each middle part a purpose. Keep them as they are. The heading on the right has room for your course or project name.
You can teach scientific writing with it or outline your own study, then adjust the shapes and text in PowerPoint, Keynote or Google Slides.