Horizontal Bar Charts Slide Infographic Template


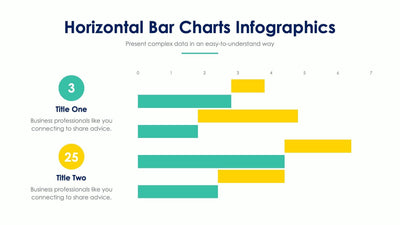
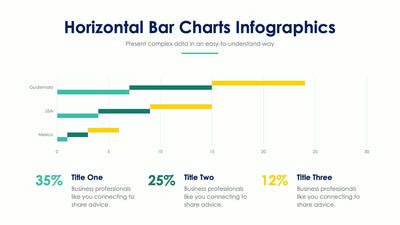
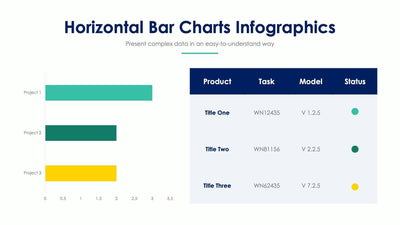
Three numbers stack down the left of the horizontal bar charts slide. Each percentage sits over a colored rule, and a matching bar chart with three bars fills the right half.
What's on the slide
- Three large figures, 35%, 65% and 45%, each with a two-line note
- Rules under the figures in teal, dark green and yellow
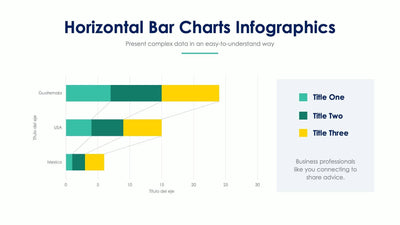
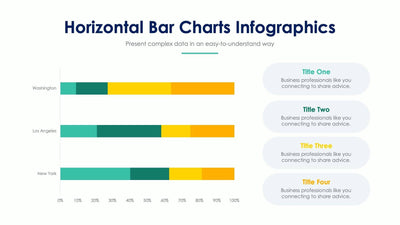
- Bars labeled Title One to Title Three on a 0 to 6 scale
- A Horizontal Bar Charts Infographics title with a short subtitle and a teal line
Put survey answers or three product results next to their bars, so your figures and your chart tell the same story. You could show it in a monthly team update or a client report. Keep it simple. Your audience reads the big figure first and the bar second, so each result gets two chances to land.
Start with the three large figures and type your own numbers over them. Then swap the sample line beside each one for a short note that says what the figure counts. On the right, rename Title One to Title Three and set each bar's value in the chart data so it matches the figure you typed on the left. The colors pair up across the slide, so keep the teal figure with the teal bar when you reorder them.
Both PowerPoint and Keynote open the file, so the chart and colors are yours to change.