Executive Summary Slide Infographic Template


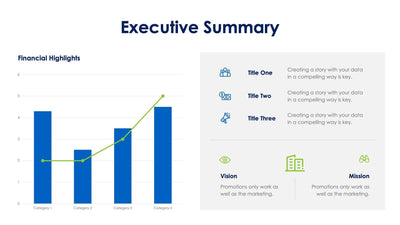
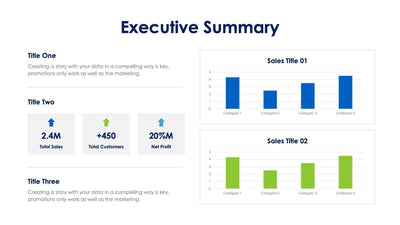
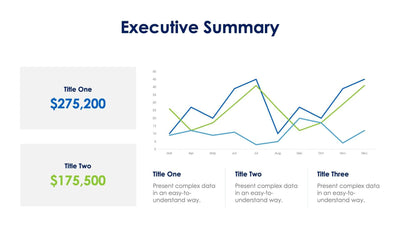
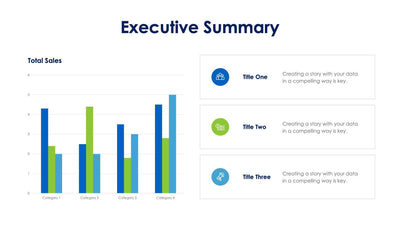
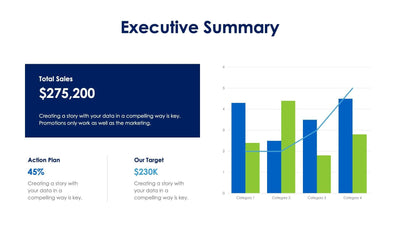
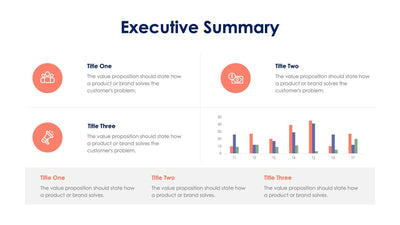
Your key numbers sit in one view on the executive summary slide. A stacked bar chart sits on the left, four progress rings on the right, and four title cards run along the bottom.
What's on the slide
- A blue and green stacked bar chart for Category 1 to Category 4
- Four rings with sample values of 70%, 55%, 30% and 45%
- Four gray cards, Title One to Title Four, each with a small icon
- Placeholder text next to every ring and in every card
- A bold Executive Summary title at the top
Swap the sample values for your own results before a board or team review. Your leaders get the main numbers before you go into the detail.
Start with the bar chart. Rename Category 1 to Category 4, then type in your own shares for the blue and green parts. Next, set each of the four rings to your own percentage and write a short line beside it. The four cards along the bottom hold your main points, one per card, each with a small icon you can swap. Keep each card to one line. If you need fewer rings, you can delete one and center the rest. You can change the chart and the rings in PowerPoint or Keynote.