Accident Insurance Infographic


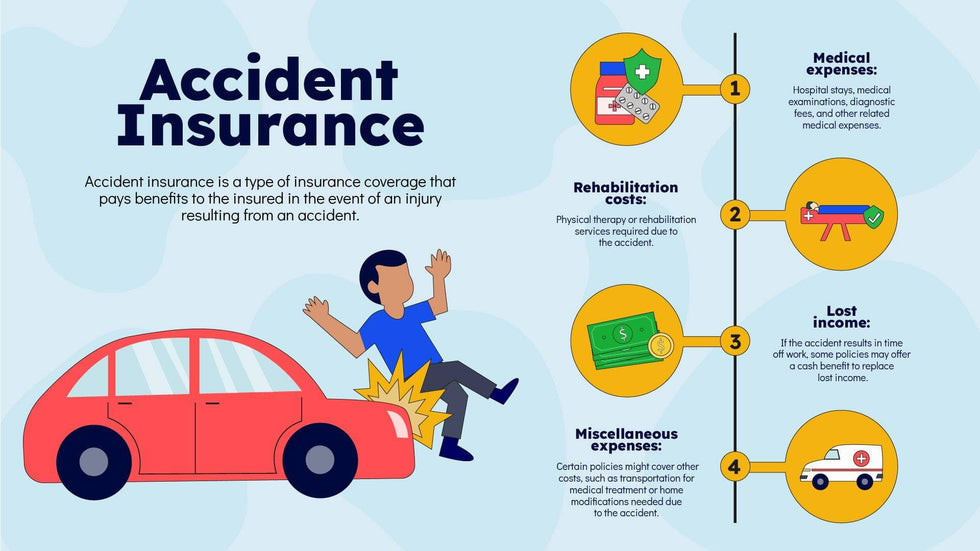
What can accident insurance cover? The accident insurance infographic slide lays out four costs. A drawing of a red car bumping into a person sits on the left, and a line of four numbered stops runs down the right.
What's on the slide
- A large navy Accident Insurance title with a short printed definition under it
- Four numbered stops: Medical expenses, Rehabilitation costs, Lost income and Miscellaneous expenses
- An icon in a yellow circle at each stop, such as a pill bottle with a shield, a stack of bills and an ambulance
- A few lines of text beside each heading
- Soft blue shapes on a pale blue background
You might use it when you meet a new client or in a benefits talk for your staff. The drawing on the left sets the scene fast, and the four stops on the right walk your listeners through what a plan can pay for. Each stop has a yellow circle with an icon, so your audience can follow along.
Rewrite each note to match your own plan. Start with the title and the short definition under it, and use the words your company uses. Then go down the four stops. Each one has a heading and a few lines, which you can keep or change to fit the plans you sell. If your plan covers something else, rename a stop and swap its icon. You can present it from PowerPoint, Keynote or Google Slides once your notes are in.