Dashboard Slide Infographic Template


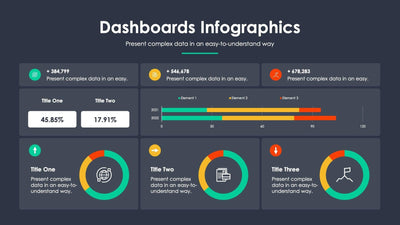
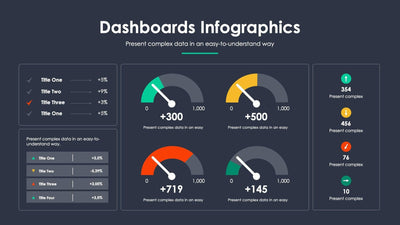
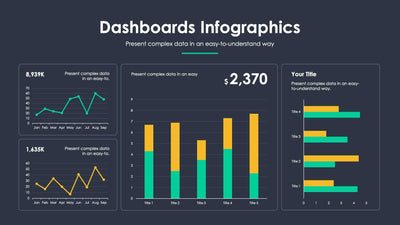
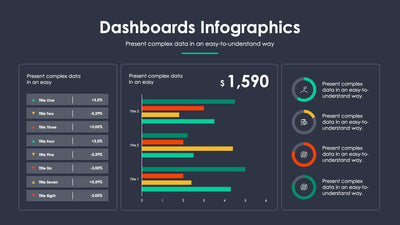
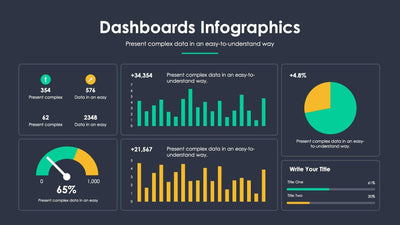
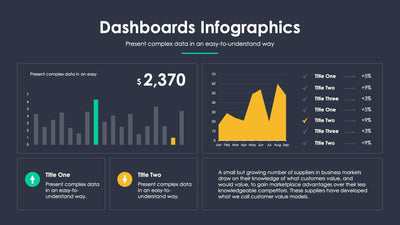
This dashboard slide sets four panels of sample metrics on a charcoal background. A gauge, a monthly table, two column charts and one large percentage share the slide under a Dashboards Infographics title.
What's on the slide
- A green gauge reading 344 on a scale from 0 to 1,000
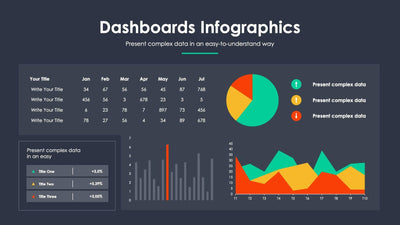
- A table of sample figures from January to July beside a red-orange column chart
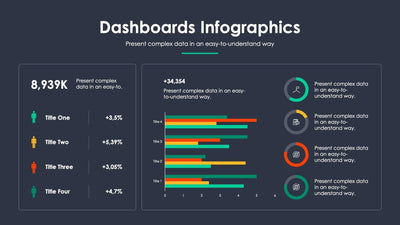
- Four titles with sample totals and up or down triangles, next to a grouped column chart
- A 6.2% figure with an up arrow in a green circle
- Placeholder labels such as Write Your Title throughout
Type in your own numbers and it is ready for your monthly review. Send it to your manager as a one-slide summary of the month.
Begin with the gauge on the top left. Set the needle and the number to your own score, and rename the label under it. Then fill the monthly table, replacing each Write Your Title row with a measure you track. Enter the same figures in the red-orange chart beside it. In the lower left, rename Title One to Title Four and type in your totals. Pick an up or down triangle for each one. The grouped chart beside them takes four sets of bars. Finally, put your headline number in the green circle.
Change the charts and colors in Keynote or PowerPoint.